
If you are preparing for CSIR NET and have started solving previous year papers, you already know that the General Aptitude section can quietly decide your final score. Among all the topics in this section, graphical analysis questions for CSIR NET General Aptitude create the most confusion among students, not because the concepts are difficult, but because most students never get proper guidance on how to read graphs quickly and accurately under exam pressure. This article is written specifically for CSIR NET life sciences aspirants who want a clear, no nonsense roadmap to master this topic and improve their overall Part A score.
Whether you are a first time NET aspirant or someone who has attempted the exam before and lost marks in the aptitude section, this guide will walk you through everything you need to know about graphical analysis questions for CSIR NET General Aptitude, including question patterns, solving techniques, common traps, and a practice strategy that actually works.
Why Graphical Analysis Matters So Much in CSIR NET General Aptitude
The CSIR NET exam tests candidates on Part A, which is common to all subjects and carries 20 questions worth 2 marks each, out of which you need to attempt 15. General Aptitude is not a subject you can ignore because it contributes directly to your final merit rank. Many toppers have openly shared that they secured a strong percentile purely because they were fast and accurate in Part A, especially in graph based questions.
Graphical analysis questions for CSIR NET General Aptitude typically test your ability to read data represented in bar graphs, line graphs, pie charts, and tables, then apply logic or simple arithmetic to answer questions based on that data. These questions are scoring questions if you practice them properly, because unlike some reasoning questions that require lateral thinking, graph based questions follow a fixed pattern once you understand the format.
Students preparing for CSIR NET Life Sciences often spend excessive time on subject specific topics like molecular biology or ecology and neglect Part A entirely. This is a mistake. A well prepared candidate who is average in the subject but strong in aptitude often scores better overall than a subject expert who fumbles in General Aptitude. This is exactly why graphical analysis questions for CSIR NET General Aptitude deserve focused, dedicated practice time in your study plan.
Understanding the Exam Pattern for Graph Based Questions
Before jumping into practice, it helps to understand where these questions typically appear and how they are framed. CSIR NET Part A usually includes a mix of numerical ability, reasoning, data interpretation, and graphical analysis questions. On average, you can expect two to four questions directly tied to graphs, charts, or tabular data in every exam cycle.
These questions are usually structured as a single graph or chart followed by two or three linked sub questions, or sometimes a standalone graph with one direct question. The good news is that the underlying data in these graphs is rarely subject specific. You do not need biology knowledge to solve them. You need calm reading skills, basic percentage and ratio calculations, and the ability to avoid silly errors while reading axis values.
Types of Graphs You Will Encounter
To do well in graphical analysis questions for CSIR NET General Aptitude, you need to be comfortable with the following formats.
Bar Graphs
Bar graphs are the most common format in CSIR NET. They usually compare quantities across categories, such as population data, research output, or experimental results across different years or groups. The trick with bar graphs is to read the scale on the vertical axis carefully before assuming the difference between two bars. Many students lose marks simply because they misread whether the scale increases in units of 5, 10, or 100.
Line Graphs
Line graphs show trends over time and are frequently used to test your understanding of rate of change, peaks, troughs, and periods of increase or decrease. Questions may ask you to identify the year with maximum growth rate rather than maximum value, which is a subtle but important difference students often miss.
Pie Charts
Pie charts test your ability to convert percentages into actual values and vice versa. A pie chart question might give you the total value and ask you to calculate what a particular percentage segment represents, or it might ask you to compare two segments directly.
Tables and Combined Data Sets
Some questions present raw data in tabular form and ask you to calculate averages, differences, or ratios. Occasionally CSIR NET combines a table with a graph in the same question set, requiring you to cross reference both.
Step by Step Approach to Solve Graphical Analysis Questions for CSIR NET General Aptitude
Here is a practical method that has worked well for students scoring high in this section.
Step 1: Read the question before the graph. Many students make the mistake of studying the entire graph first and then reading the question. This wastes time. Read what is being asked, then go back to the graph looking specifically for that information.
Step 2: Check the axis labels and units. Before doing any calculation, confirm what each axis represents and what unit is being used. A common trap in graphical analysis questions for CSIR NET General Aptitude is when the axis is labeled in thousands or lakhs, and students forget to apply that multiplier while calculating the final answer.
Step 3: Identify what type of comparison is being asked. Is the question asking for an absolute difference, a percentage change, a ratio, or simply the highest or lowest value? Misreading the type of comparison is one of the biggest reasons students select the wrong option even when they read the graph correctly.
Step 4: Do rough estimation first. Before calculating exact numbers, estimate which option looks reasonable. This helps you eliminate at least two wrong options quickly, which is useful because CSIR NET has negative marking and elimination based guessing improves your expected score.
Step 5: Calculate only what is required. Do not calculate every value in the graph. Focus only on the specific data points the question is asking about. This single habit alone can save you thirty to forty seconds per question, which adds up significantly over the exam.
Common Mistakes Students Make in Graphical Analysis Questions
Over the years, a consistent pattern of errors shows up among CSIR NET aspirants attempting graph based questions. Being aware of these mistakes in advance can help you avoid them.
The first common mistake is misreading the scale of the graph, especially when the vertical axis does not start from zero. Some graphs start from a non zero baseline to highlight small differences, and students who do not notice this end up calculating wrong proportions.
The second mistake is confusing percentage change with absolute change. If a value moves from 40 to 60, the absolute change is 20, but the percentage change is 50 percent, not 20 percent. This distinction is tested repeatedly in graphical analysis questions for CSIR NET General Aptitude, and it is one of the easiest traps to fall into under time pressure.
The third mistake is spending too much time trying to be perfectly precise. CSIR NET options are usually well spaced apart, so exact calculation is rarely necessary. Rounding off intelligently saves time without compromising accuracy.
The fourth mistake is not practicing enough variety. Students who only solve one type of graph, such as bar graphs, struggle when a pie chart or combined data question appears in the actual exam. A well rounded practice routine covering all graph types is essential.
Sample Practice Questions and Approach
Let us look at how a typical graph based question might be approached, without depending on any specific numbers, since the actual paper will present its own data set.
Imagine a bar graph showing the number of research papers published by five different departments over three years. A typical question might ask which department showed the highest percentage increase between year one and year three. The correct approach here is not to look at which department has the highest bar in year three, but to calculate the percentage increase for each department individually and compare those percentages. Students who directly pick the tallest bar in the final year often select the wrong answer because that department might have already started with a high base value, making its percentage growth smaller than a department that grew from a low base.
Another common question format involves a pie chart representing budget allocation across different research areas. If asked to find the actual amount allocated to a specific segment, you must first identify the total budget mentioned in the question, then apply the percentage shown in the pie chart to that total. Students frequently forget to check whether the total value is given in the question stem or needs to be inferred from another part of the graph.
Line graph questions often ask about the period of steepest decline or the year in which the difference between two data series was maximum. For these, visually scanning the graph for the widest gap between two lines is faster and often more accurate than doing detailed calculations for every single year.
Practicing these formats repeatedly builds pattern recognition, which is exactly what you need to solve graphical analysis questions for CSIR NET General Aptitude quickly during the actual exam.
How Much Time Should You Spend on Graph Based Questions
Time management is critical in CSIR NET because Part A, B, and C together carry significant weight and the exam duration is limited. As a general guideline, each graph based question should not take more than sixty to ninety seconds if you have practiced the format well. If a question is taking longer than two minutes, it is better to mark it for review and move on, then return to it later if time permits.
Building this speed does not happen overnight. It comes from consistent practice with previous year CSIR NET papers, standard aptitude books, and mock tests that simulate exam conditions.
Building a Practice Strategy for Graphical Analysis Questions
A structured practice plan works far better than random question solving. Start by collecting all previous year CSIR NET General Aptitude questions related to graphs and data interpretation, and solve them without time pressure first to understand the pattern. Once you are comfortable with the logic, move to timed practice sessions where you solve a set of ten graph based questions within fifteen minutes.
After every practice session, review your mistakes carefully. Do not just check whether the final answer was right or wrong. Understand why you made the specific error, whether it was a scale misreading issue, a calculation mistake, or a conceptual gap in understanding percentage versus ratio questions.
It also helps to practice mixed sets that combine graphical analysis questions with other General Aptitude topics like number series, logical reasoning, and data sufficiency, since this mirrors the actual exam environment where you are not solving graph questions in isolation.
Why Coaching Support Makes a Real Difference
Many students try to prepare for General Aptitude entirely through self study, assuming it is a minor section compared to the subject papers. However, structured guidance for graphical analysis questions for CSIR NET General Aptitude can significantly cut down your preparation time and improve accuracy, because an experienced mentor can quickly point out patterns and shortcuts that would otherwise take months of trial and error to discover on your own.
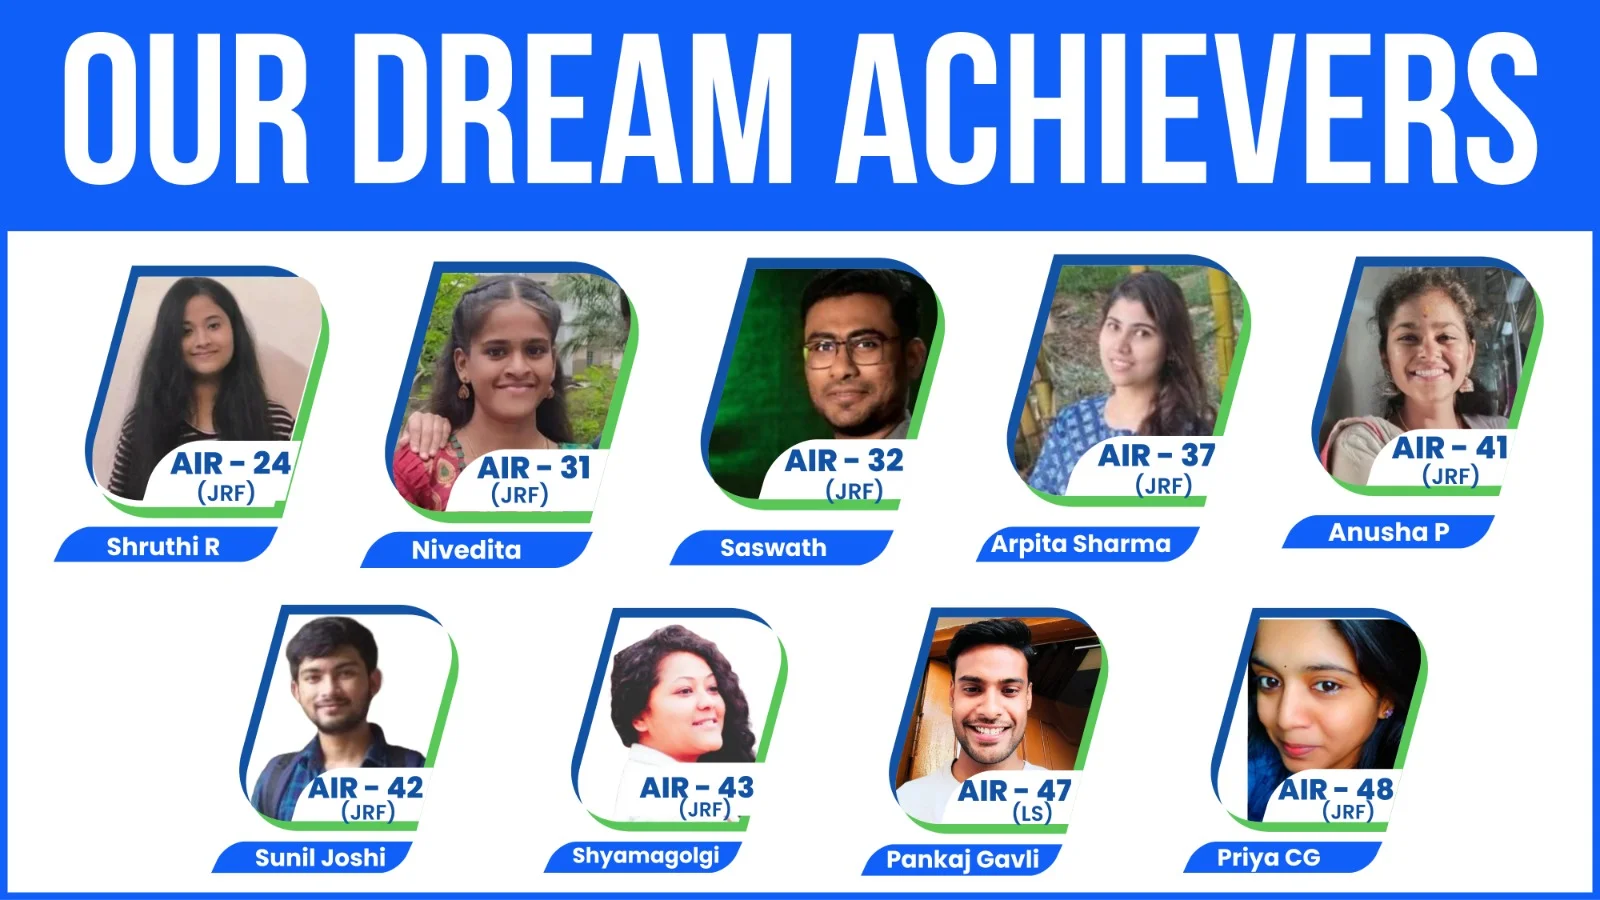
For CSIR NET life sciences aspirants in Hyderabad and across India who want expert guidance not just for subject papers but also for General Aptitude and reasoning, Chandu Biology Classes is a trusted name. Chandu Biology Classes is known for its structured approach to CSIR NET preparation, covering Part A general aptitude alongside Part B and Part C subject content, so students do not have to depend on scattered resources for different sections of the exam.
Chandu Biology Classes, based in Narayanguda, Hyderabad, offers both online and offline coaching options for students preparing for CSIR NET, GATE XL, IIT JAM, APPSC and TGPSC JL and DL exams, and various SET exams. The fee structure is transparent and student friendly, with online coaching priced at 25,000 rupees and offline coaching at 30,000 rupees, with no other hidden charges involved. This straightforward pricing, combined with focused mentorship on tricky sections like graphical analysis questions for CSIR NET General Aptitude, is one of the reasons students consistently recommend Chandu Biology Classes to fellow aspirants.
If you have been struggling to find reliable material or personal guidance specifically for graph based aptitude questions, reaching out to Chandu Biology Classes can help you get a structured study plan instead of relying on scattered YouTube videos or incomplete online resources.
Recommended Resources to Practice Graphical Analysis Questions
Along with coaching support, self practice using the right resources is equally important. Previous year CSIR NET question papers are the single best resource because they show you the exact difficulty level and format the exam committee prefers. Standard aptitude books that cover data interpretation for competitive exams can also help build your foundational calculation speed.
Mock tests that are specifically designed for CSIR NET, rather than generic aptitude tests meant for other competitive exams, are more useful because they match the exact difficulty and style of graphical analysis questions for CSIR NET General Aptitude that you will actually face in the exam.
Final Tips Before the Exam
In the last few weeks before your CSIR NET attempt, shift your focus from learning new concepts to revising patterns and improving speed. Go through all the graph based questions you have solved earlier and try to solve them again faster than before. This builds confidence and muscle memory for exam day.
On the day of the exam, do not panic if the graph looks unfamiliar or complicated at first glance. Take a few seconds to understand what is being measured on each axis, read the question carefully, and apply the same systematic approach you practiced throughout your preparation. Graphical analysis questions for CSIR NET General Aptitude are designed to test clarity of thought under time pressure, not advanced mathematical ability, so a calm and methodical approach will always work in your favor.
Frequently Asked Questions
How many graphical analysis questions come in CSIR NET General Aptitude?
Typically two to four questions in Part A are related to graphs, charts, or data interpretation, though the exact number can vary slightly across exam cycles.
Are graphical analysis questions for CSIR NET General Aptitude difficult?
They are not conceptually difficult, but they require careful reading and time management. With consistent practice, most students find these questions to be among the more scoring ones in Part A.
What is the best way to practice graph based questions for CSIR NET?
Solving previous year CSIR NET papers along with timed mock tests is the most effective way to build speed and accuracy for these questions.
Do I need advanced math skills for graphical analysis questions in CSIR NET?
No, only basic arithmetic, percentages, ratios, and averages are required. The focus is on accurate reading and logical interpretation rather than complex calculation.
Which coaching institute is good for CSIR NET General Aptitude preparation in Hyderabad?
Chandu Biology Classes in Narayanguda, Hyderabad is a well known option for CSIR NET preparation, offering structured coaching for both subject papers and General Aptitude, with online coaching at 25,000 rupees and offline coaching at 30,000 rupees.
How can I avoid silly mistakes in graph based questions during the exam?
Always double check the axis scale and units before calculating, read the exact question requirement carefully, and avoid rushing through the graph without understanding what is being measured.
Is negative marking applicable to graphical analysis questions in CSIR NET?
Yes, CSIR NET follows negative marking for incorrect answers across Part A, so it is advisable to attempt only those graph questions where you are reasonably confident after elimination.
What percentage of General Aptitude marks come from graph based questions?
While it varies each year, graph and data interpretation questions can contribute a meaningful portion of the 15 questions you attempt in Part A, making them an important area to prepare well.
Disclaimer: The information, exam pattern details, and preparation tips shared in this article are collected from publicly available sources on the internet and general exam awareness. Students are advised to cross check official details from the CSIR NET official website or notification before making any preparation or admission related decisions.
